TorontoLive
Geo Concordances
Every neighbourhood boundary, joined across census years. The key that unlocks every time series.
For analysts, journalists, and city staff
An open-source data project. Not affiliated with the Government of Canada or the City of Toronto.
Open Nshipyard
We turn messy public data into open infrastructure: explorer interfaces for humans, documented APIs and MCP tools for AI agents. Starting with Canada's civic data, already answering questions about the whole planet.
The problem
Hundreds of Toronto's open datasets are published but barely usable: inconsistent schemas, free-text fields, and missing keys force every analyst to redo the same cleaning by hand. We do it once, in the open, so nobody has to again. Starting with Toronto, now expanding across Canada and worldwide.
722,000
street-name variants across parking tickets, entered by hand
57.8%
of building-permit cost fields are non-numeric
600+
311 problem codes, in a taxonomy retired in 2019
16 → 34
neighbourhoods split in the census re-cut, breaking every time series
The projects
Each project takes one messy public dataset and turns it into something a person can explore and a machine can query. One repo per project, versioned releases, open methodology. Most start with Canadian civic data; the worldwide ones prove the pattern travels.
Every neighbourhood boundary, joined across census years. The key that unlocks every time series.
For analysts, journalists, and city staff
160,000 business licences mapped to NAICS codes. Corridor analytics without the keyword guessing.
For BIAs, brokers, and B2B prospecting
The codes behind the pipes, finally documented. Including the missing lead classification.
For engineers and Toronto Water
One stable ID for every Toronto property. The master key for joining it all together.
For everyone building on property data
850+ request types, versioned so renames stop breaking history.
For city operations and researchers
50 million tickets, geocoded and mappable for the first time.
For fleets, mobility, and insurers
NOC, infraction, and procurement codes, translated into one reference.
For analysts, staffing, and watchdogs
Every project in the housing pipeline, normalized and queryable.
For developers, lenders, and media
Who gets the city's money: $21.5B in awards resolved to 4,082 canonical vendors.
For journalists, vendors, and watchdogs
Where Canada has flooded since 2000, live rainfall radar and alerts, and what protection exists: 21,983 events, 1,109 km of BC dikes.
For emergency planners, insurers, and residents
Does transit make land gold and housing cheap? The decomposition, tested where open data allows: 141,098 homes within 800m of 67 stations.
For housing researchers, planners, and journalists
Toronto's 202,779 active building permits, normalized from 31 messy CKAN fields into 8 clean ones, behind one documented API.
For developers, journalists, and civic hackers
Live satellite hotspots and fire perimeters, 54 years of burned-area history, and explainable fire-weather watch scores: 52,610 fires, 132.6M ha.
For emergency planners, journalists, and residents
What got built near the stations: 125 rail stations joined to 2,314 development projects. 41.1% of the pipeline sits within 800m of an open station.
For housing researchers, planners, and journalists
1.24M delay incidents since 2014 on one comparable taxonomy, across the 2025 code break.
For riders, journalists, and transit advocates
The ripple, measured: Kitchener-Waterloo new-home prices up 46.7% since 2017 vs Toronto up 2.9%. Hamilton's cycle turns 6 months before Toronto's.
For housing researchers, planners, and journalists
The geometry of affordability, computed: 82.5 livable km² by transit vs 339.5 by car in 30 minutes. GO Expansion adds 17.7 km², the most per dollar.
For transit planners, housing researchers, and journalists
Every Toronto traffic camera site and red-light intersection ranked by tickets and implied fines. 2.15M speed-camera tickets; $424.1M in red-light fines.
For drivers, journalists, and the curious
On the one AI question both countries asked identically, Canada was ahead: 12.2% vs 10.0%.
For investors, founders, and policy people
831 property-management companies ranked by RentSafeTO scores. 34 red-rated buildings.
For renters, journalists, and housing advocates
84 restaurant chains ranked by food-safety infraction rates.
For diners, parents, and public-health watchers
How much more the same GPU costs in a Canadian cloud region than in the US.
For AI founders, infra teams, and investors
Where Ottawa's $800M+ in AI spending actually went, vendor by vendor.
For journalists, VCs, and policy people
Tools
Some things aren't data to explore. They're tools you use: live watch systems, a search engine for the planet, a street lookup, Canada's economic data. Same open methodology, a different shape.
What's happening on your street this week? Live road work and building permits within 500 metres of any Toronto address, pulled straight from the city's open data.
For anyone with a Toronto address
Ask the planet a question: natural-language search over satellite imagery embeddings.
For researchers, journalists, and the curious
Live tropical cyclone risk scores from official hurricane forecasts, with the math shown.
For ports, vessels, and coastal communities
Canada's economic data, FRED-style: verified StatCan and Bank of Canada series with recession shading, vintage history, and one-click downloads.
For economists, journalists, and investors
A hazard data factory: global news turned into a structured, queryable open dataset of under-observed hazard events, starting with landslides.
For researchers, insurers, and emergency planners
Type any Toronto address and get a build verdict: the zone and dimensional envelope, Chapter 900 exceptions in plain English, Committee of Adjustment approval odds from 33,992 decided applications, laneway suite screening, and a development-charge estimate.
For builders, architects, and investors
Showcase
Each chart below is currently impossible to build from the city's open data. Each one becomes a query once its project ships.
 Live project
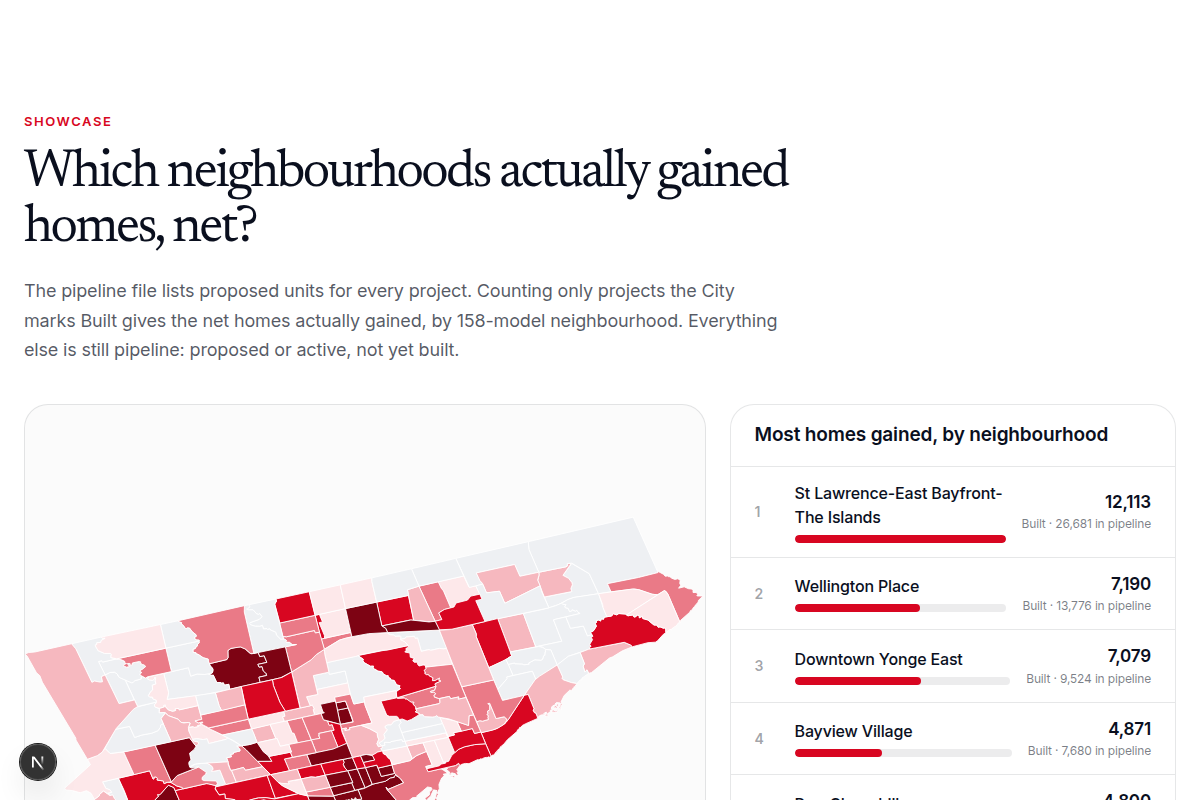
124,326 homes sit in projects the City marks Built: the net homes gained. St Lawrence-East Bayfront-The Islands leads with 12,113.
Explore the data
 Live project
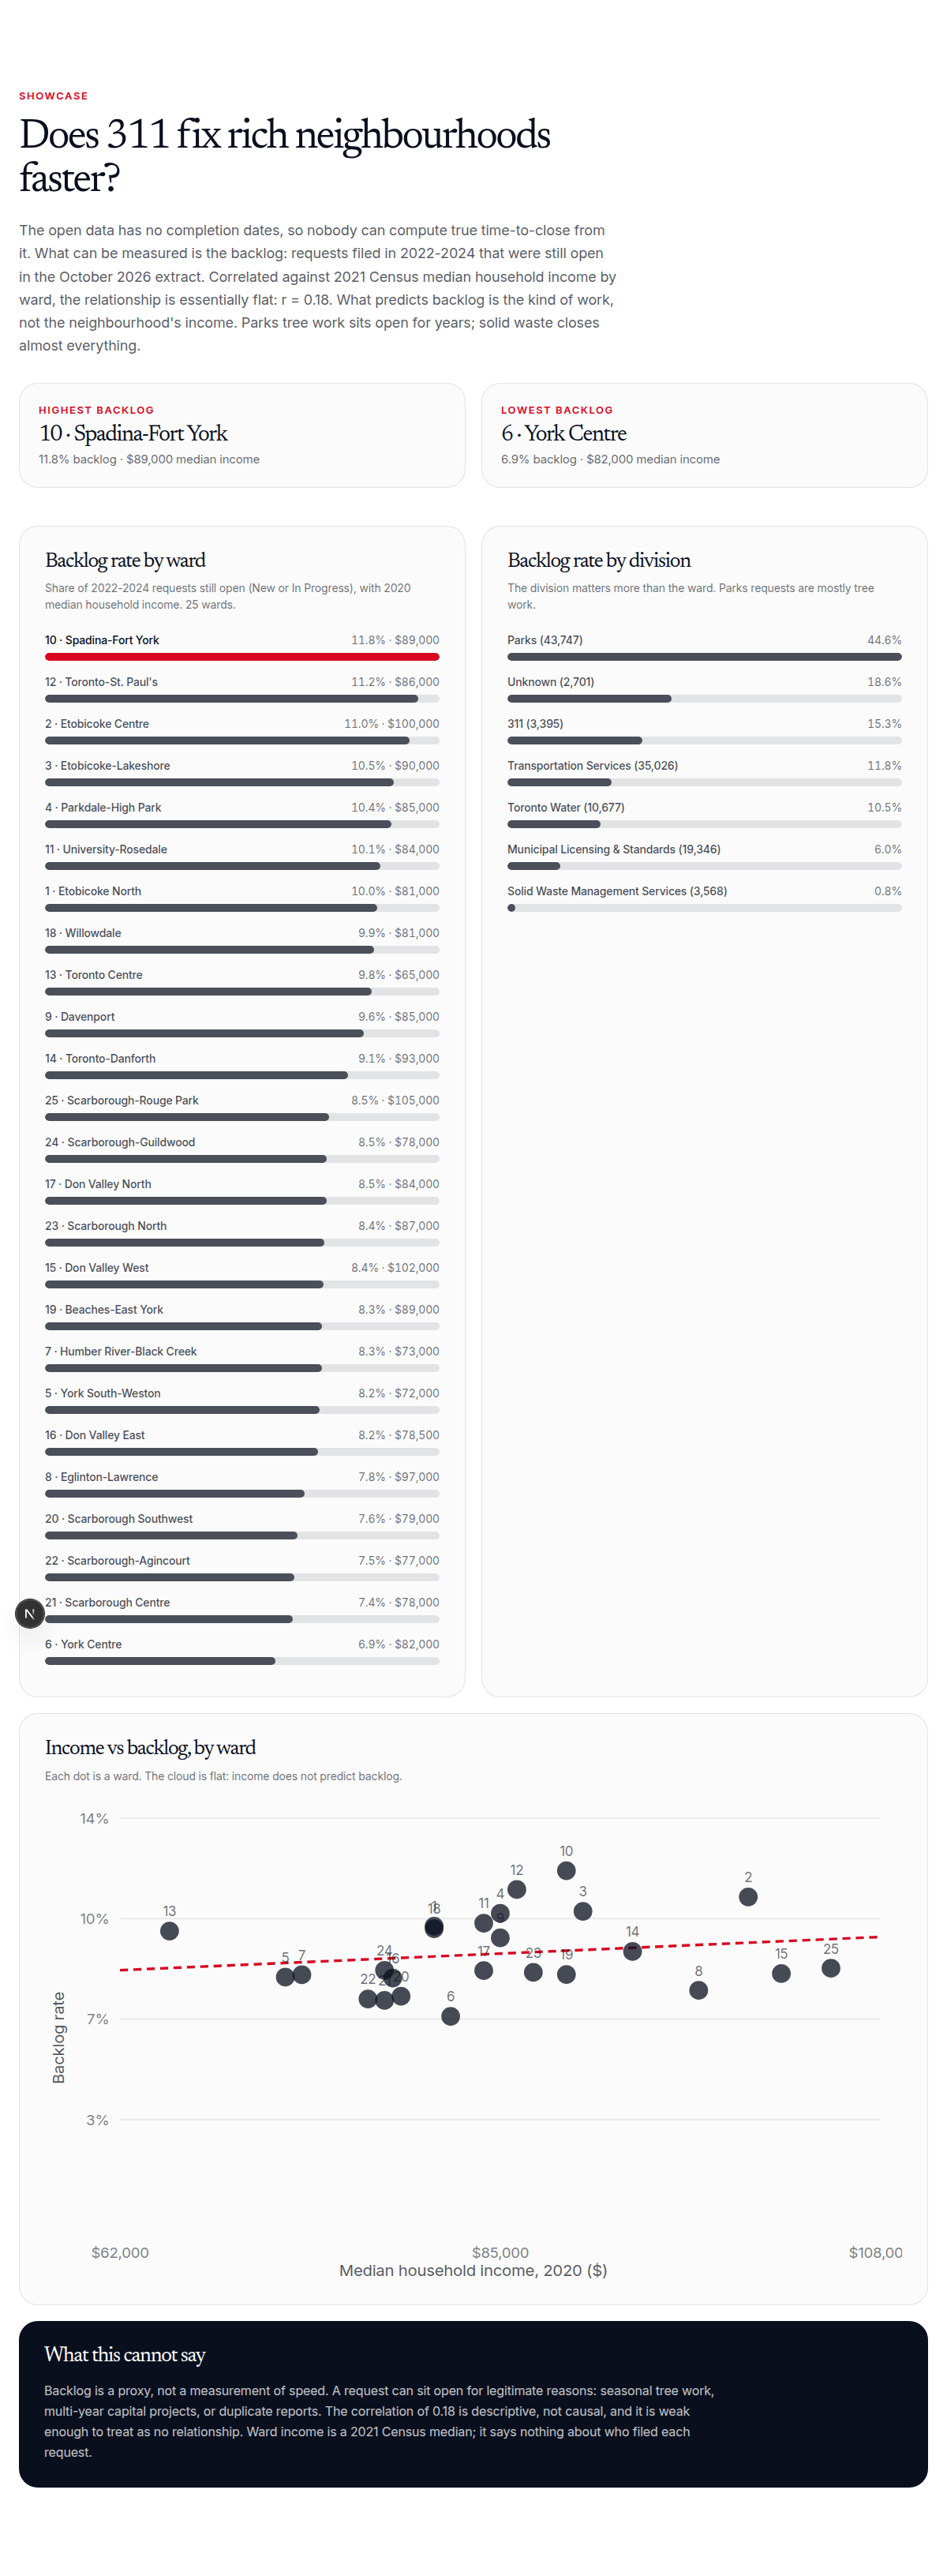
Essentially no: backlog vs ward income correlates at r = 0.18. What predicts backlog is the kind of work, not the income. Parks tree work sits open for years.
Explore the data
 Live project
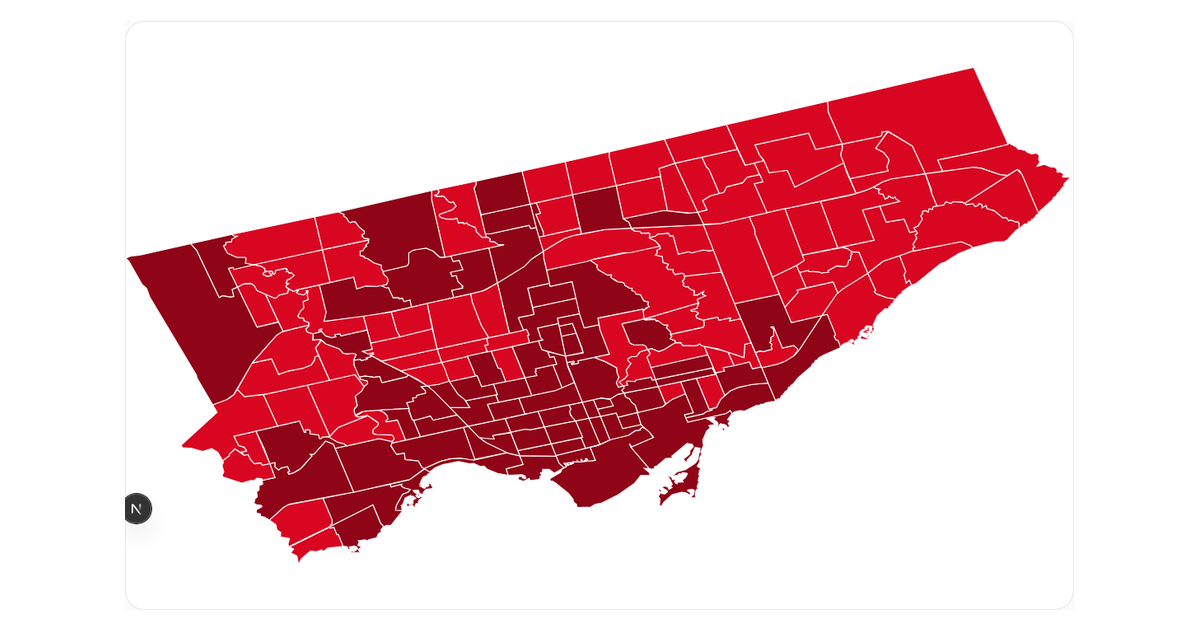
Ward 10 (Spadina-Fort York) takes 14.5% of all tickets; private lots, not streets, are the top infraction at 19.4%.
Explore the data
 Live project
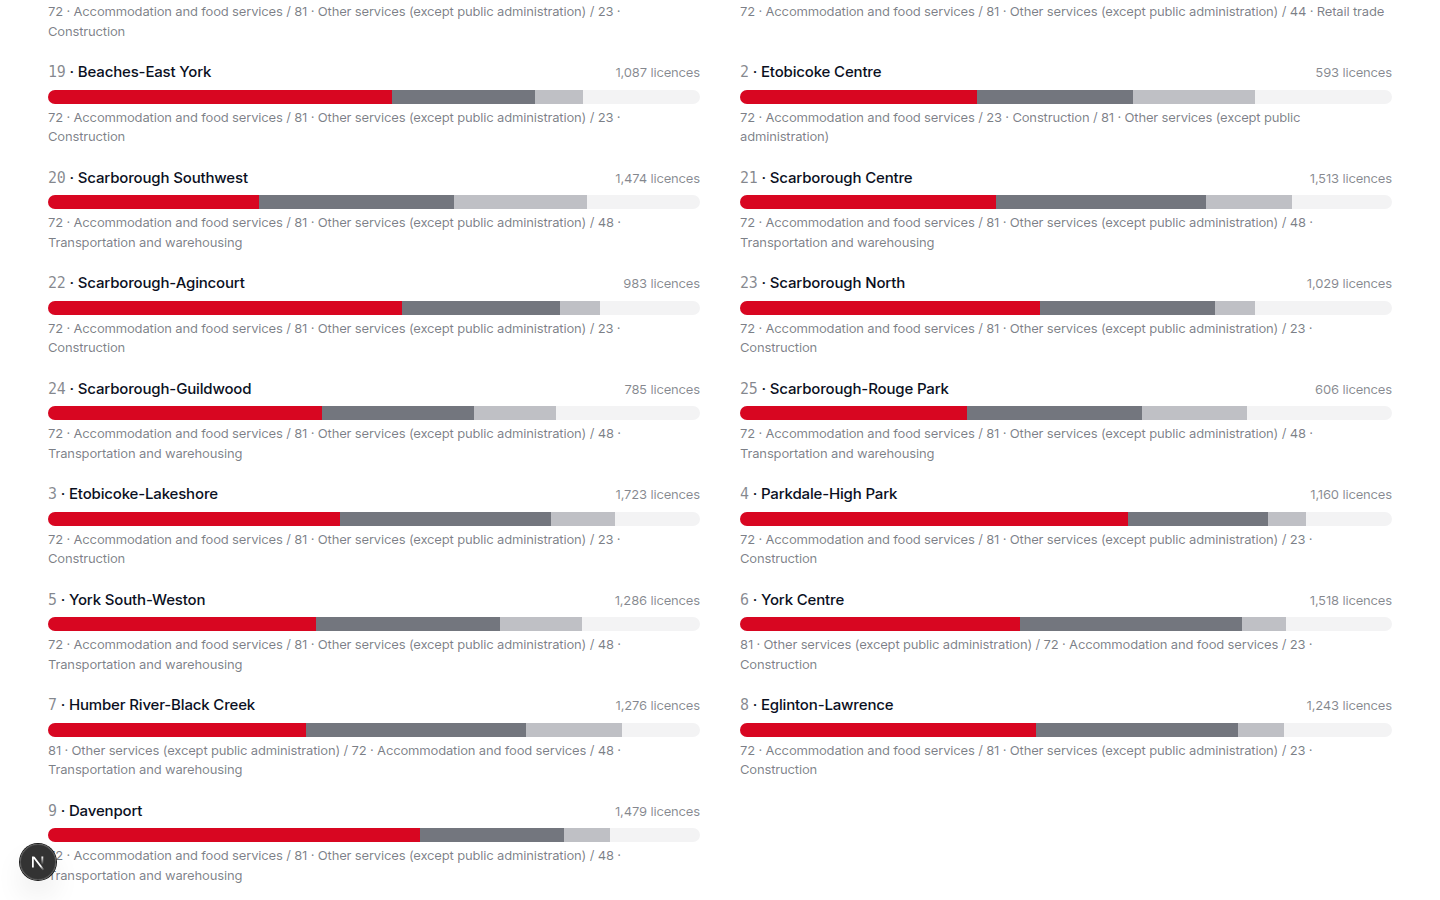
Every Toronto licence mapped to its industry: food services are 43% of active licences, and only Wards 6 and 7 break the pattern.
Explore the data
 Live project
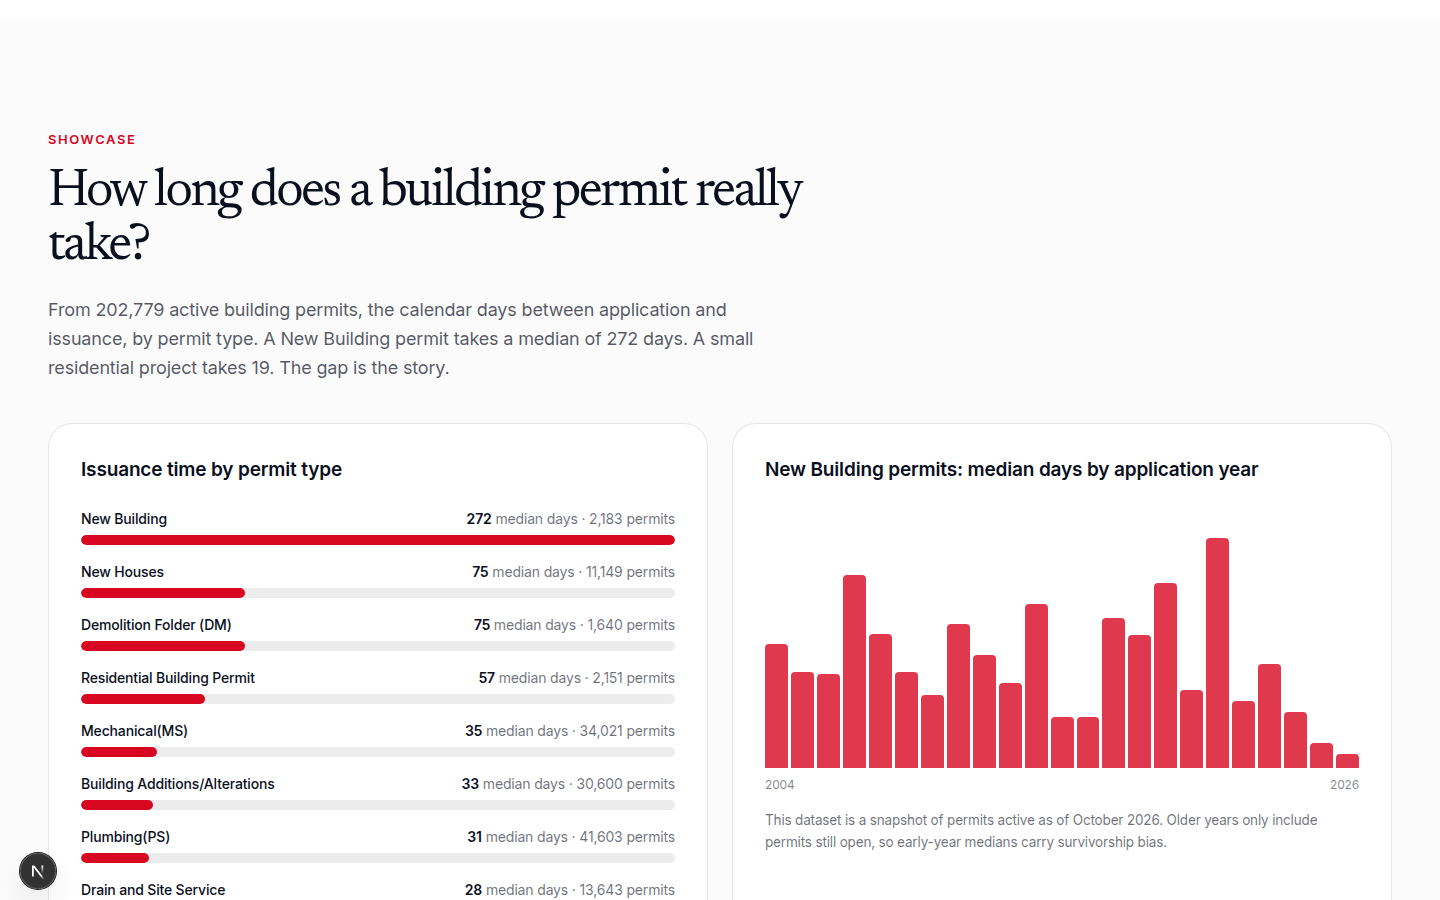
A New Building permit takes a median of 272 days from application to issuance. A small residential project takes 19 days.
Explore the data
 Live project
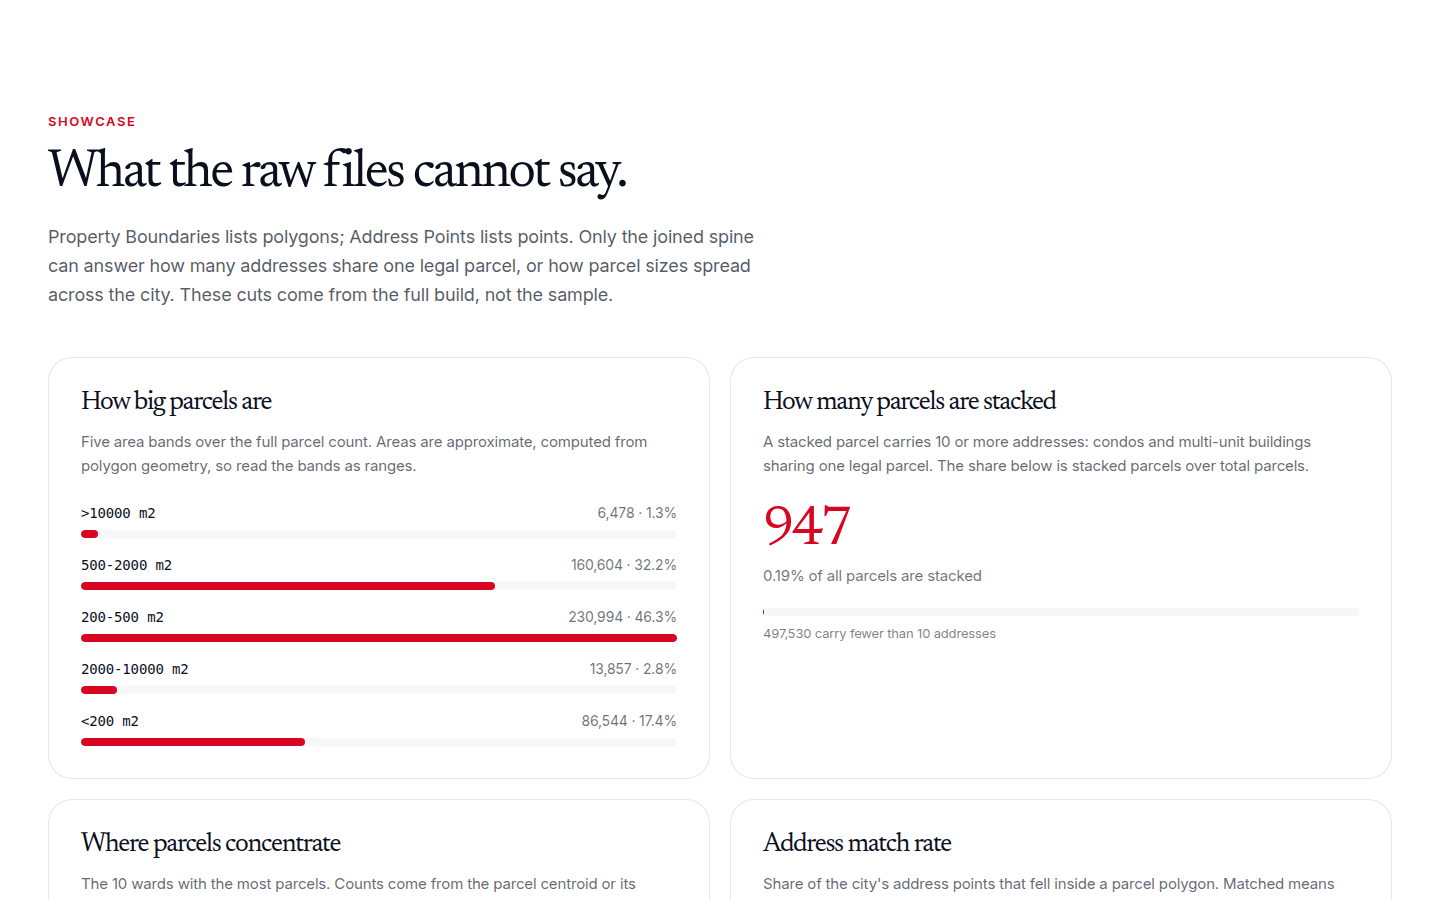
947 parcels carry 10 or more addresses each. The densest, TOP-10643486 in Ward 10, stacks 36 addresses on a single property boundary.
Explore the data
 Live project
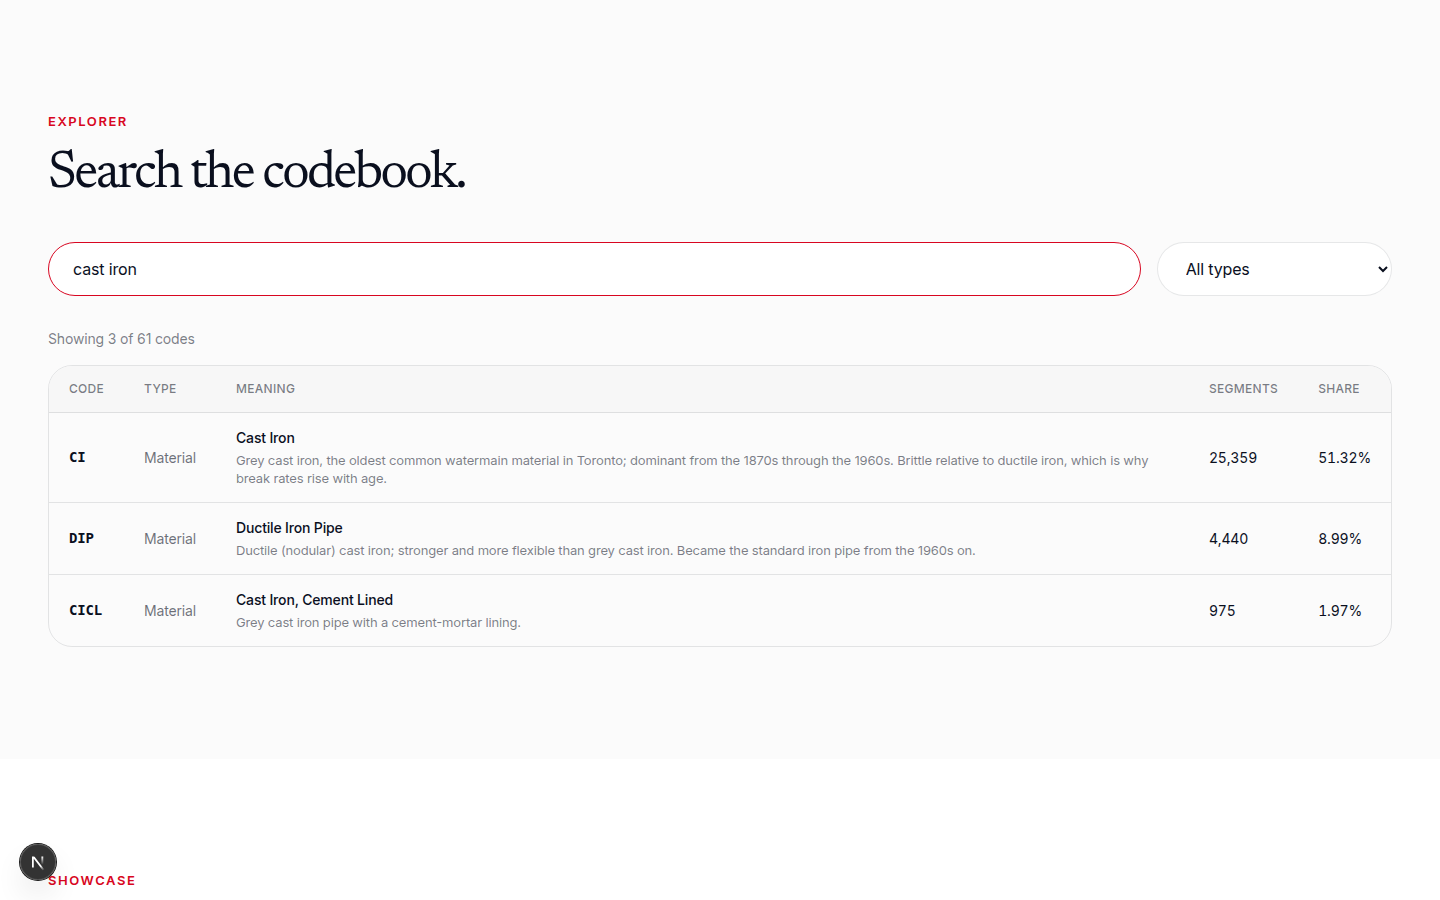
16,949 pipe segments (2,014.9 km) were installed before 1955, the city's lead-service era cutoff, and 91.6% of them are cast iron. Toronto-St. Paul's has the highest lead-era share at 84.2%.
Explore the data
 Live project
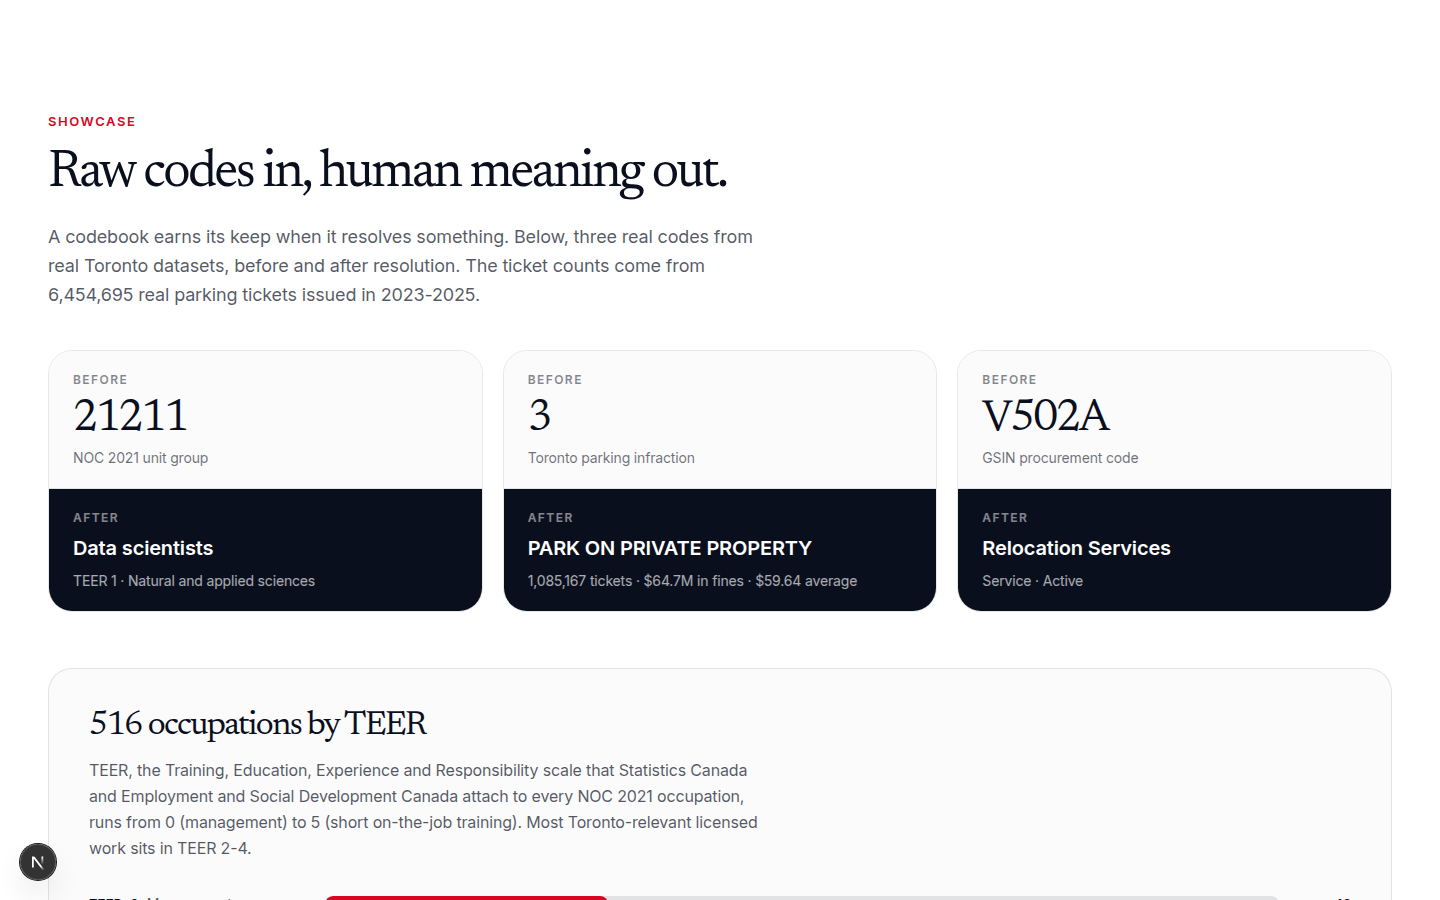
516 occupation codes, 195 parking infraction codes, and 4,909 federal procurement codes, each with a plain-English meaning. CI on a watermain record means cast iron; now every code like it is looked up, not guessed.
Explore the data
 Live project
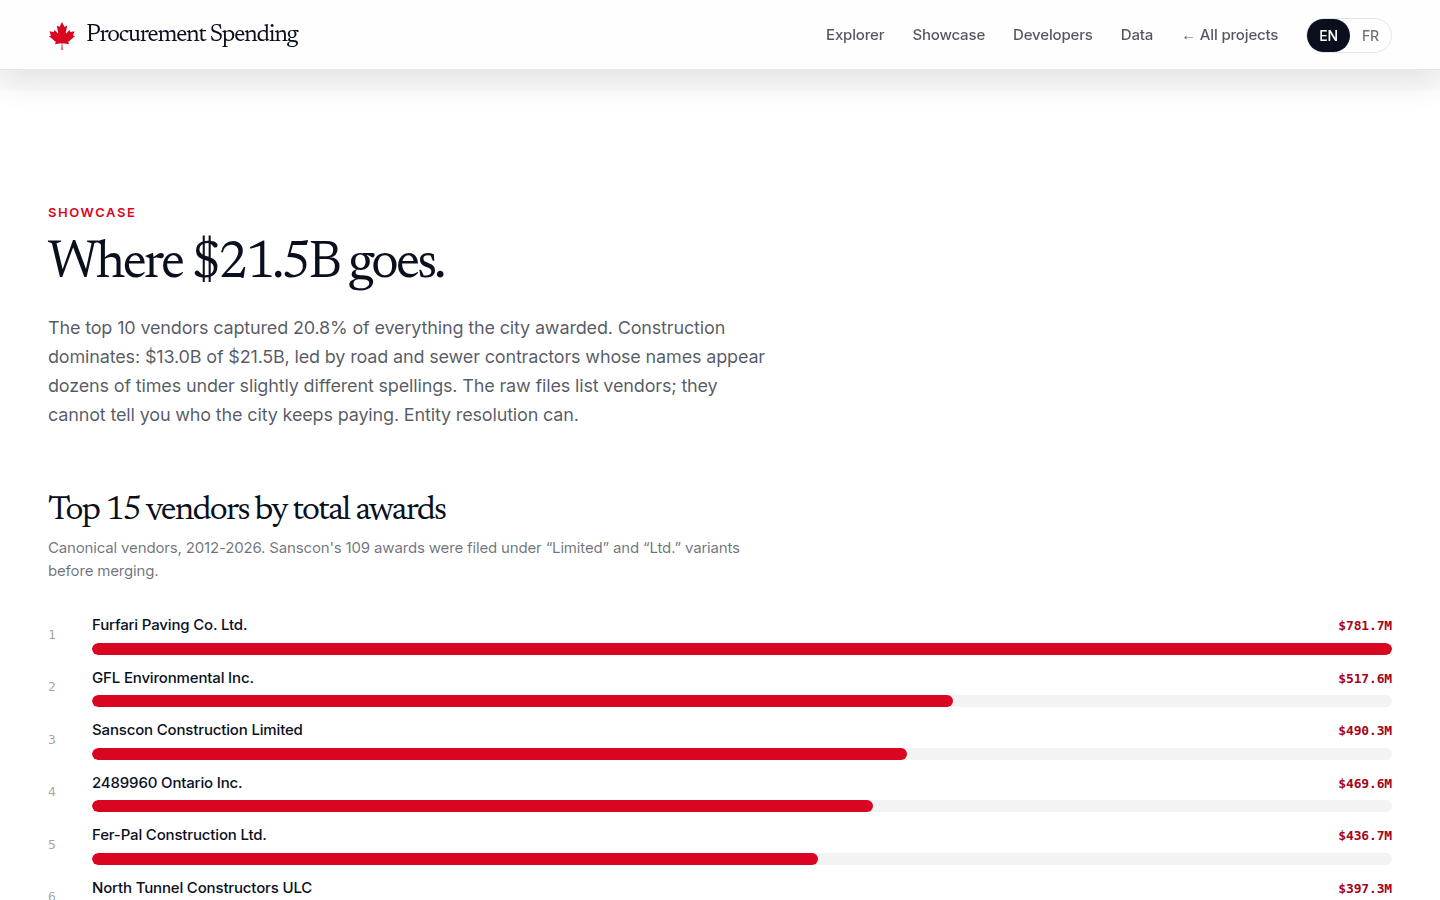
4,240 raw vendor name spellings collapse into 4,082 real vendors across $21.5B in awards from 2012 to 2026. The top vendors and the long tail are finally countable.
Explore the data
For developers
Every project ships three ways to consume it: a visual explorer, a documented REST API, and MCP tools over streamable HTTP, so AI agents can query the data directly.
One endpoint, one answer.
GET https://canada.nshipyard.com/api/v1/geo/neighbourhood?hood_140=42

{
  "hood_140": 42,
  "hood_158": [43, 44],
  "name_158": ["West Humber-Clairville", "…"],
  "ward_25": 1,
  "cma": 535
}
Connect your agent
The federated MCP server exposes every project's tools under one endpoint, namespaced by project. Pick your harness, copy the prompt, send it to your agent. Your agent runs the setup itself.
Set up the Nshipyard open-data MCP server so I can query every dataset from here.
1. Run: claude mcp add --transport http nshipyard https://canada.nshipyard.com/mcp
2. Run `claude mcp list` to confirm it connected.
3. Which ward has the most parking tickets, and what is the median wait for a New Building permit there?, and show me the result.
Open source
Every project lives in its own public repo under the Nshipyard organization: MIT licensed, versioned data releases, open methodology. If publishers clean up their own data, we will happily become redundant.